Multifractality in one dimensional distributions
To show how multifractality can be studied, let us take a sample of random numbers of a symmetric Lévy distribution.
Univariate random numbers from a Lévy stable distribution
To obtain a sample of random numbers of Lévy stable distributions, use scipy’s levy_stable. In particular, take an \(\alpha\)-stable distribution, with \(\alpha=1.5\)
# Imports
from MFDFA import MFDFA
from scipy.stats import levy_stable

# Generate 100000 points
alpha = 1.5
X = levy_stable.rvs(alpha=alpha, beta = 0, size=10000)
For MFDFA to detect the multifractal spectrum of the data, we need to vary the parameter \(q\in[-10,10]\) and exclude \(0\). Let us also use a quadratic polynomial fitting by setting order=2
# Select a band of lags, which are ints
lag = np.unique(np.logspace(0.5, 3, 100).astype(int))

# Select a list of powers q
q_list = np.linspace(-10,10,41)
q_list = q_list[q_list!=0.0]

# The order of the polynomial fitting
order = 2

# Obtain the (MF)DFA as
lag, dfa = MFDFA(y, lag = lag, q = q_list, order = order)
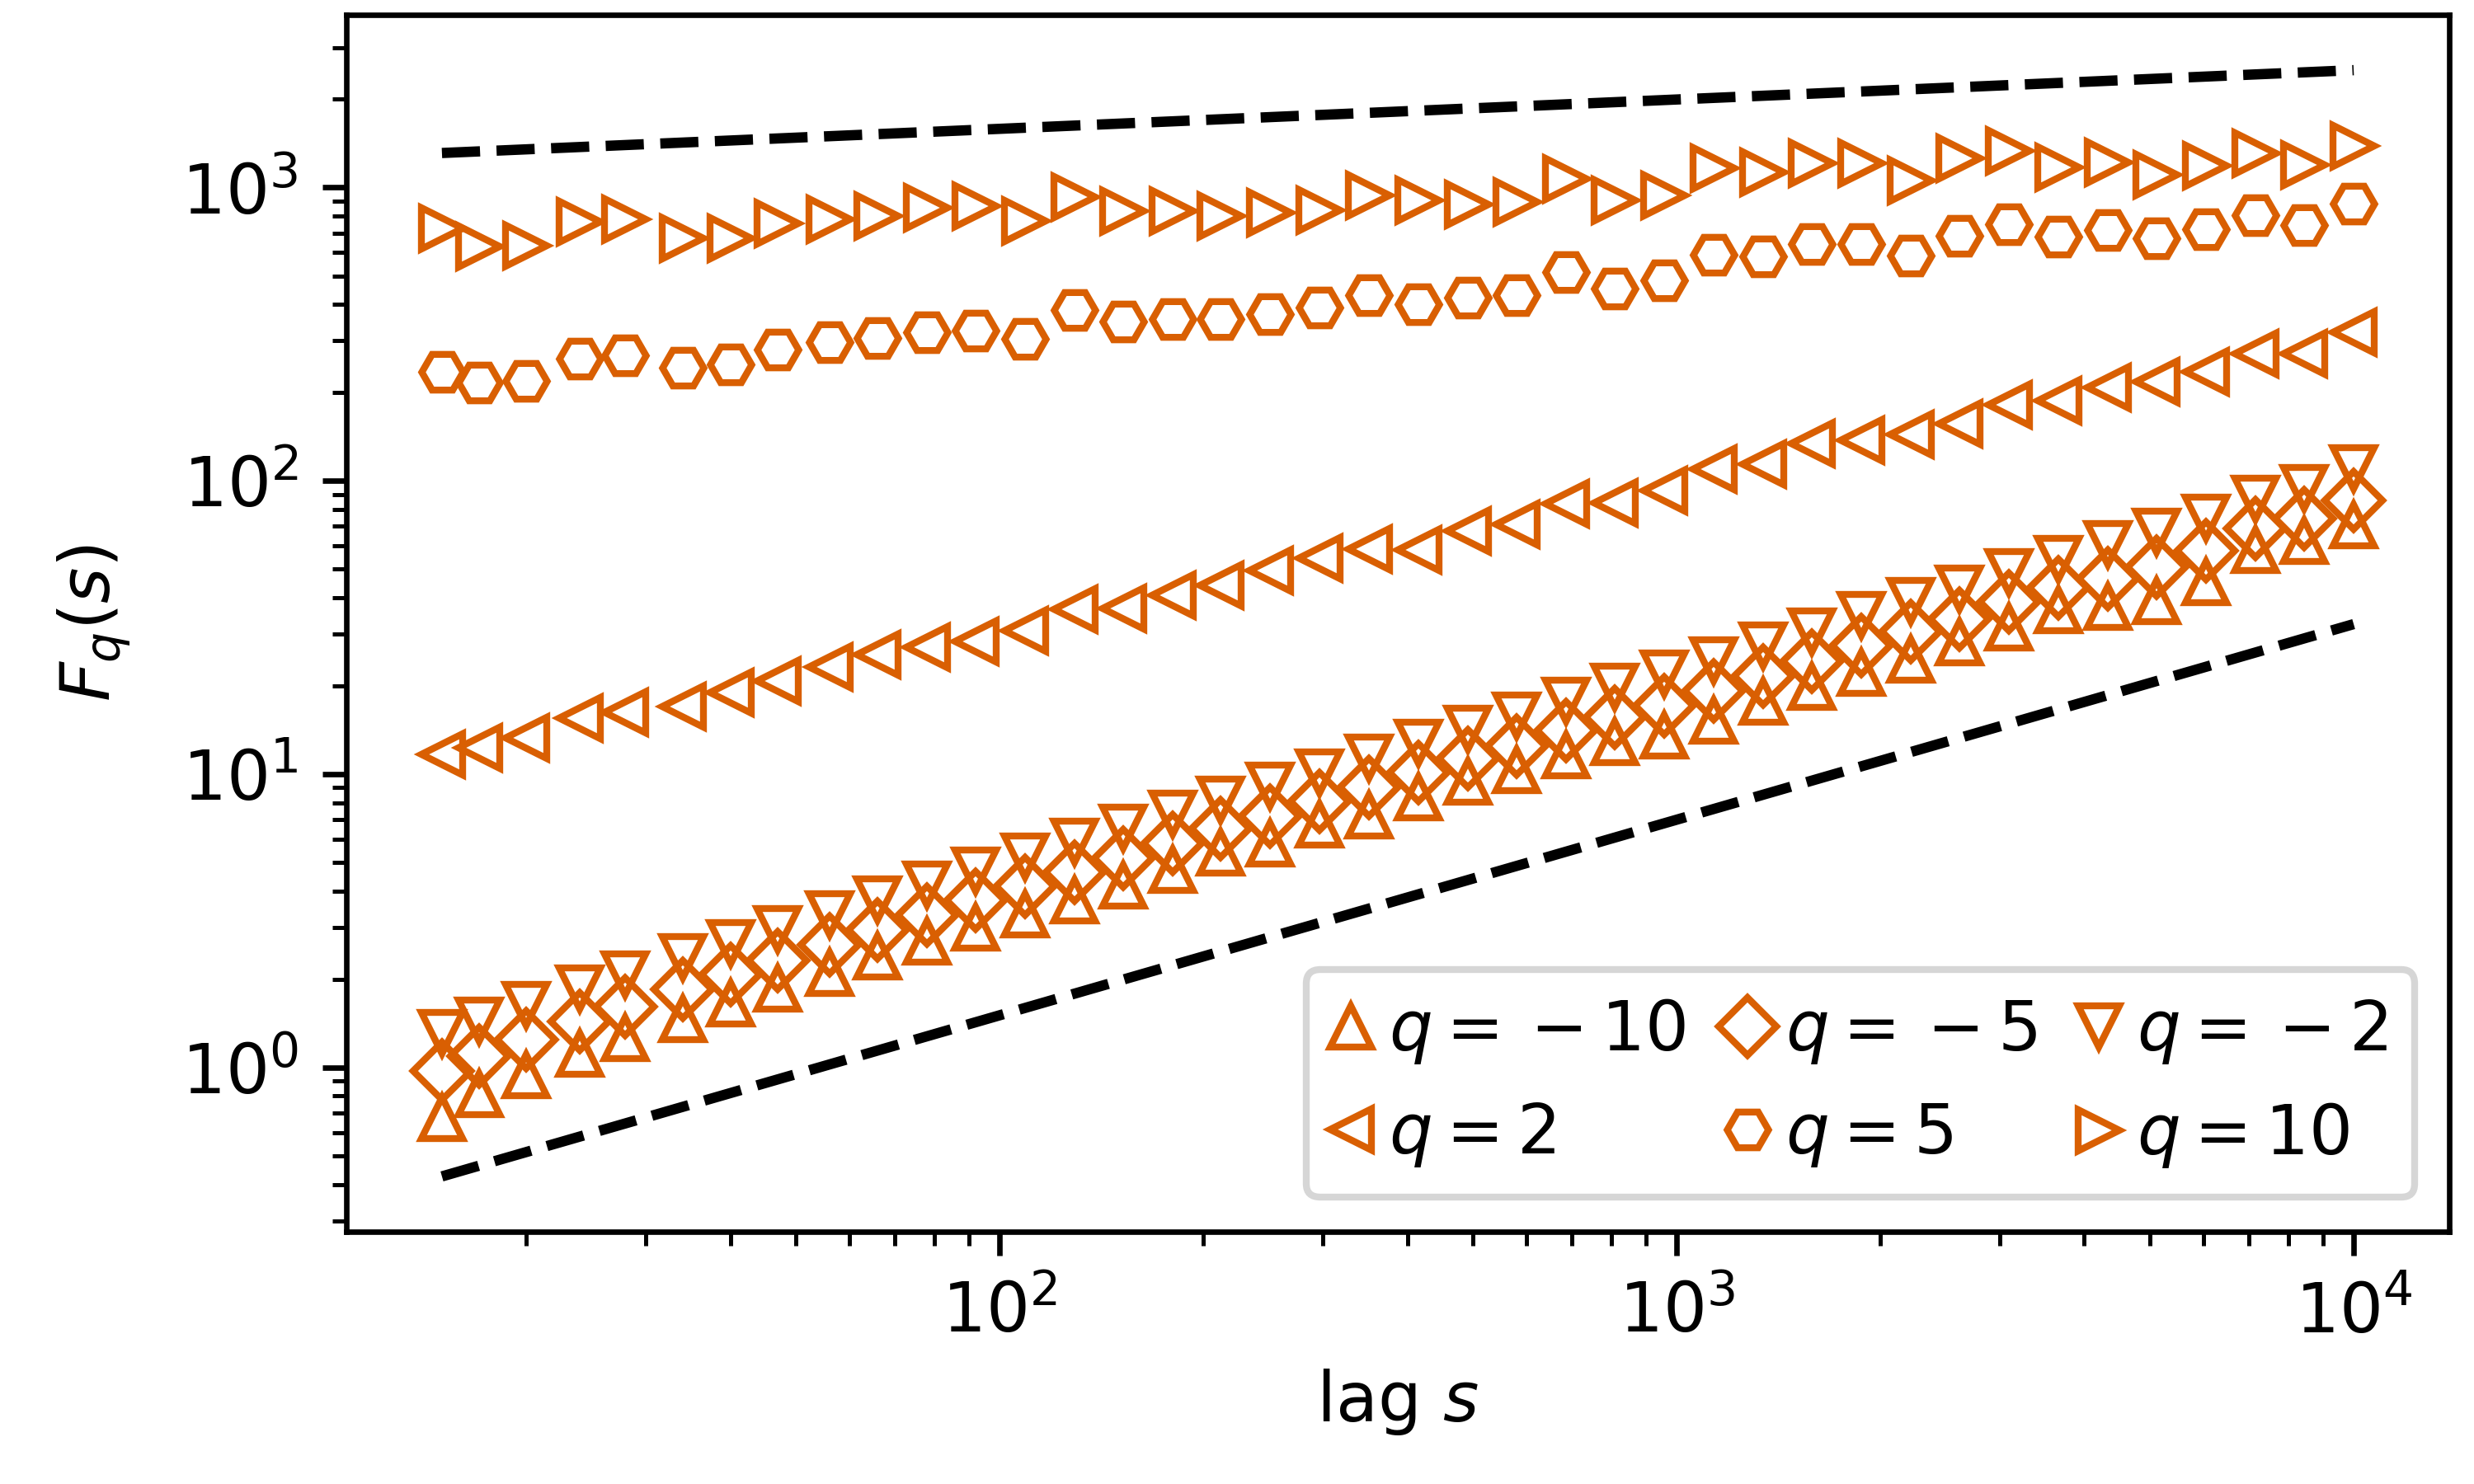
Again, we plot this in a double logarithmic scale, but now we include 6 curves, from 6 selected \(q={-10,-5-2,2,5,10}\). Include as well are the theoretical curves for \(q=-10\), with a slope of \(1/\alpha=1/1.5\) and \(q=10\), with a slope of \(1/q=1/10\)